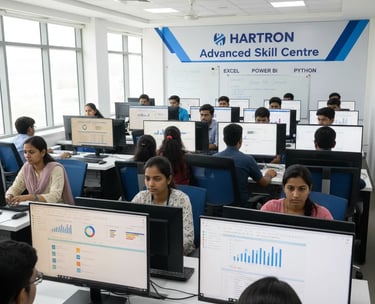
Futureproof Your Growth with HARTRON Advanced SKill centre, ballabgarh

Data Analytics
Course Duration - 6 Months Fee - ₹25,000/- ₹21,000/-


In today’s digital world, Data Analytics is the backbone of every smart decision — from business strategy to customer experience. With billions of data points generated every second, professionals skilled in analyzing, interpreting, and visualizing data are in high demand.
At HARTRON Advanced Skill Centre, Ballabgarh, our Data Analytics Course is designed to make you industry-ready by blending practical tools, real-world case studies, and government-certified training.
What You’ll Learn
Module 1: Fundamentals of Computers and Excel
Understanding computer systems and file structures
MS Excel basics to advanced: formulas, functions, pivot tables, charts
Data cleaning and formatting for analysis
Case Study: Data Cleaning using Excel

Module 2: Introduction to Data Analysis and Statistics
What is data and its types
Sampling techniques and data distribution
Measures of central tendency and dispersion
Hypothesis testing and correlation
Real-world examples of statistical analysis
Module 3: Database Management using SQL
Database fundamentals and relational models
Writing SQL queries: SELECT, JOIN, GROUP BY, HAVING, etc.
Data extraction and transformation
Hands-on practice with MySQL / PostgreSQL
Mini Project: Query-based data analysis


Module 4: Data Analysis using Python / R
Introduction to Python for data analysis
Data manipulation using Pandas and NumPy
Data visualization using Matplotlib and Seaborn
Introduction to R for statistical analysis
Mini Project: Real-world data exploration
Module 5: Data Visualization using Power BI / Tableau
Creating dashboards and reports
Connecting datasets and building KPIs
Interactive charts and storytelling with data
Best practices in dashboard design
Project: Create your own BI Dashboard


NSQF level - 4.0 Eligibility - 12th Grade Pass
Contact Us
Get in touch
Support
visit us
hartronballabhgarh@gmail.com
© 2025. All rights reserved.
Write us